

Power BI Reporting
We help organisations design, build, automate and publish effective Power BI reports and dashboards.
Why we love Power BI
Microsoft Power BI is an amazing set of tools and services that allow ordinary people to analyse their data and more effectively communicate their stories.
The desktop application is a powerful data analysis tool and report designer. The easy-to-use interface gives access to remarkably powerful features.
The Power BI service is a cloud-based platform that allows data and reports to be shared securely and updated automatically.
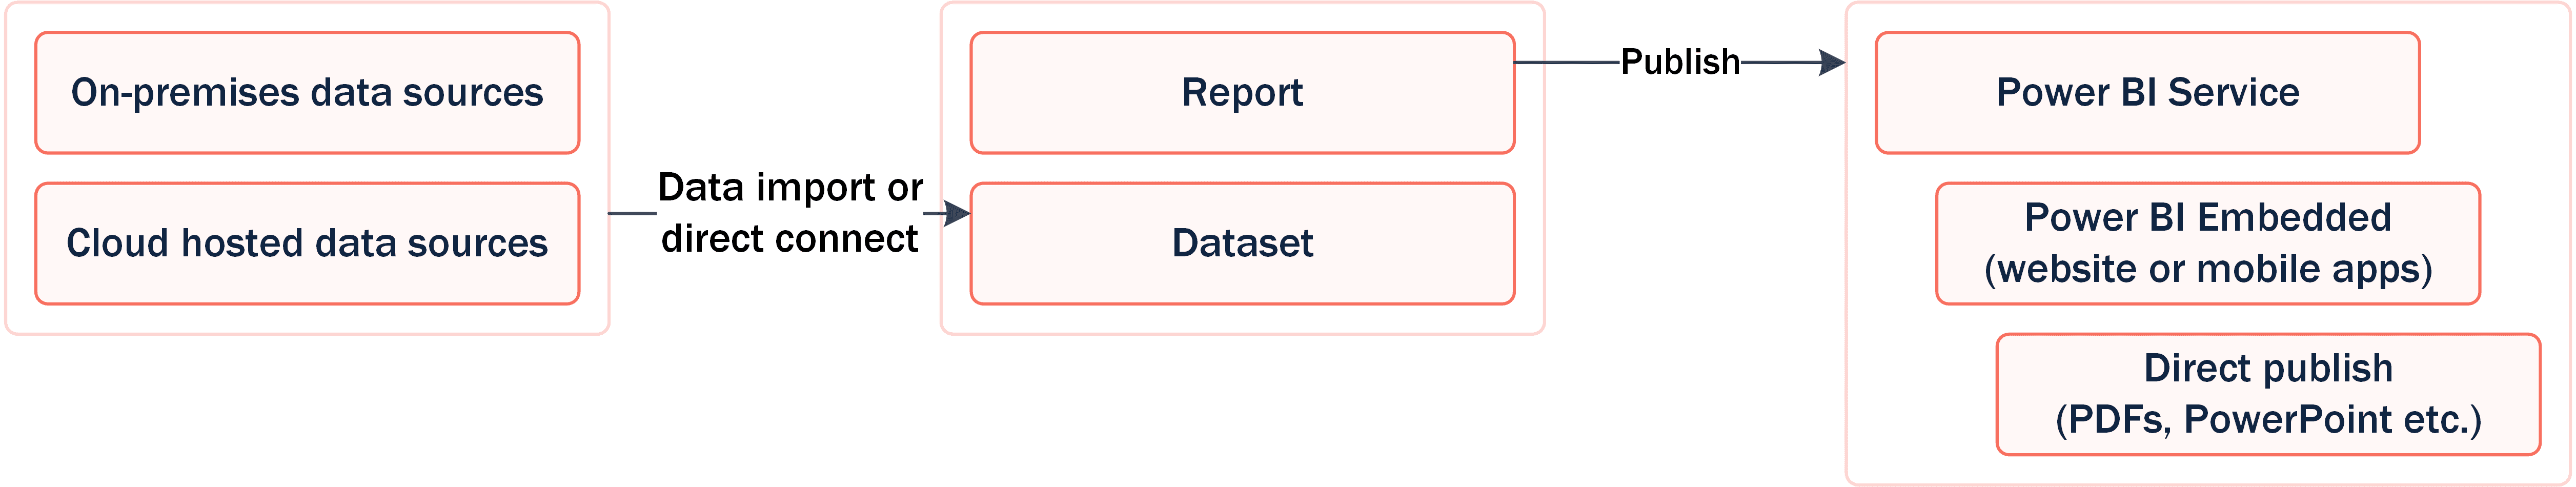
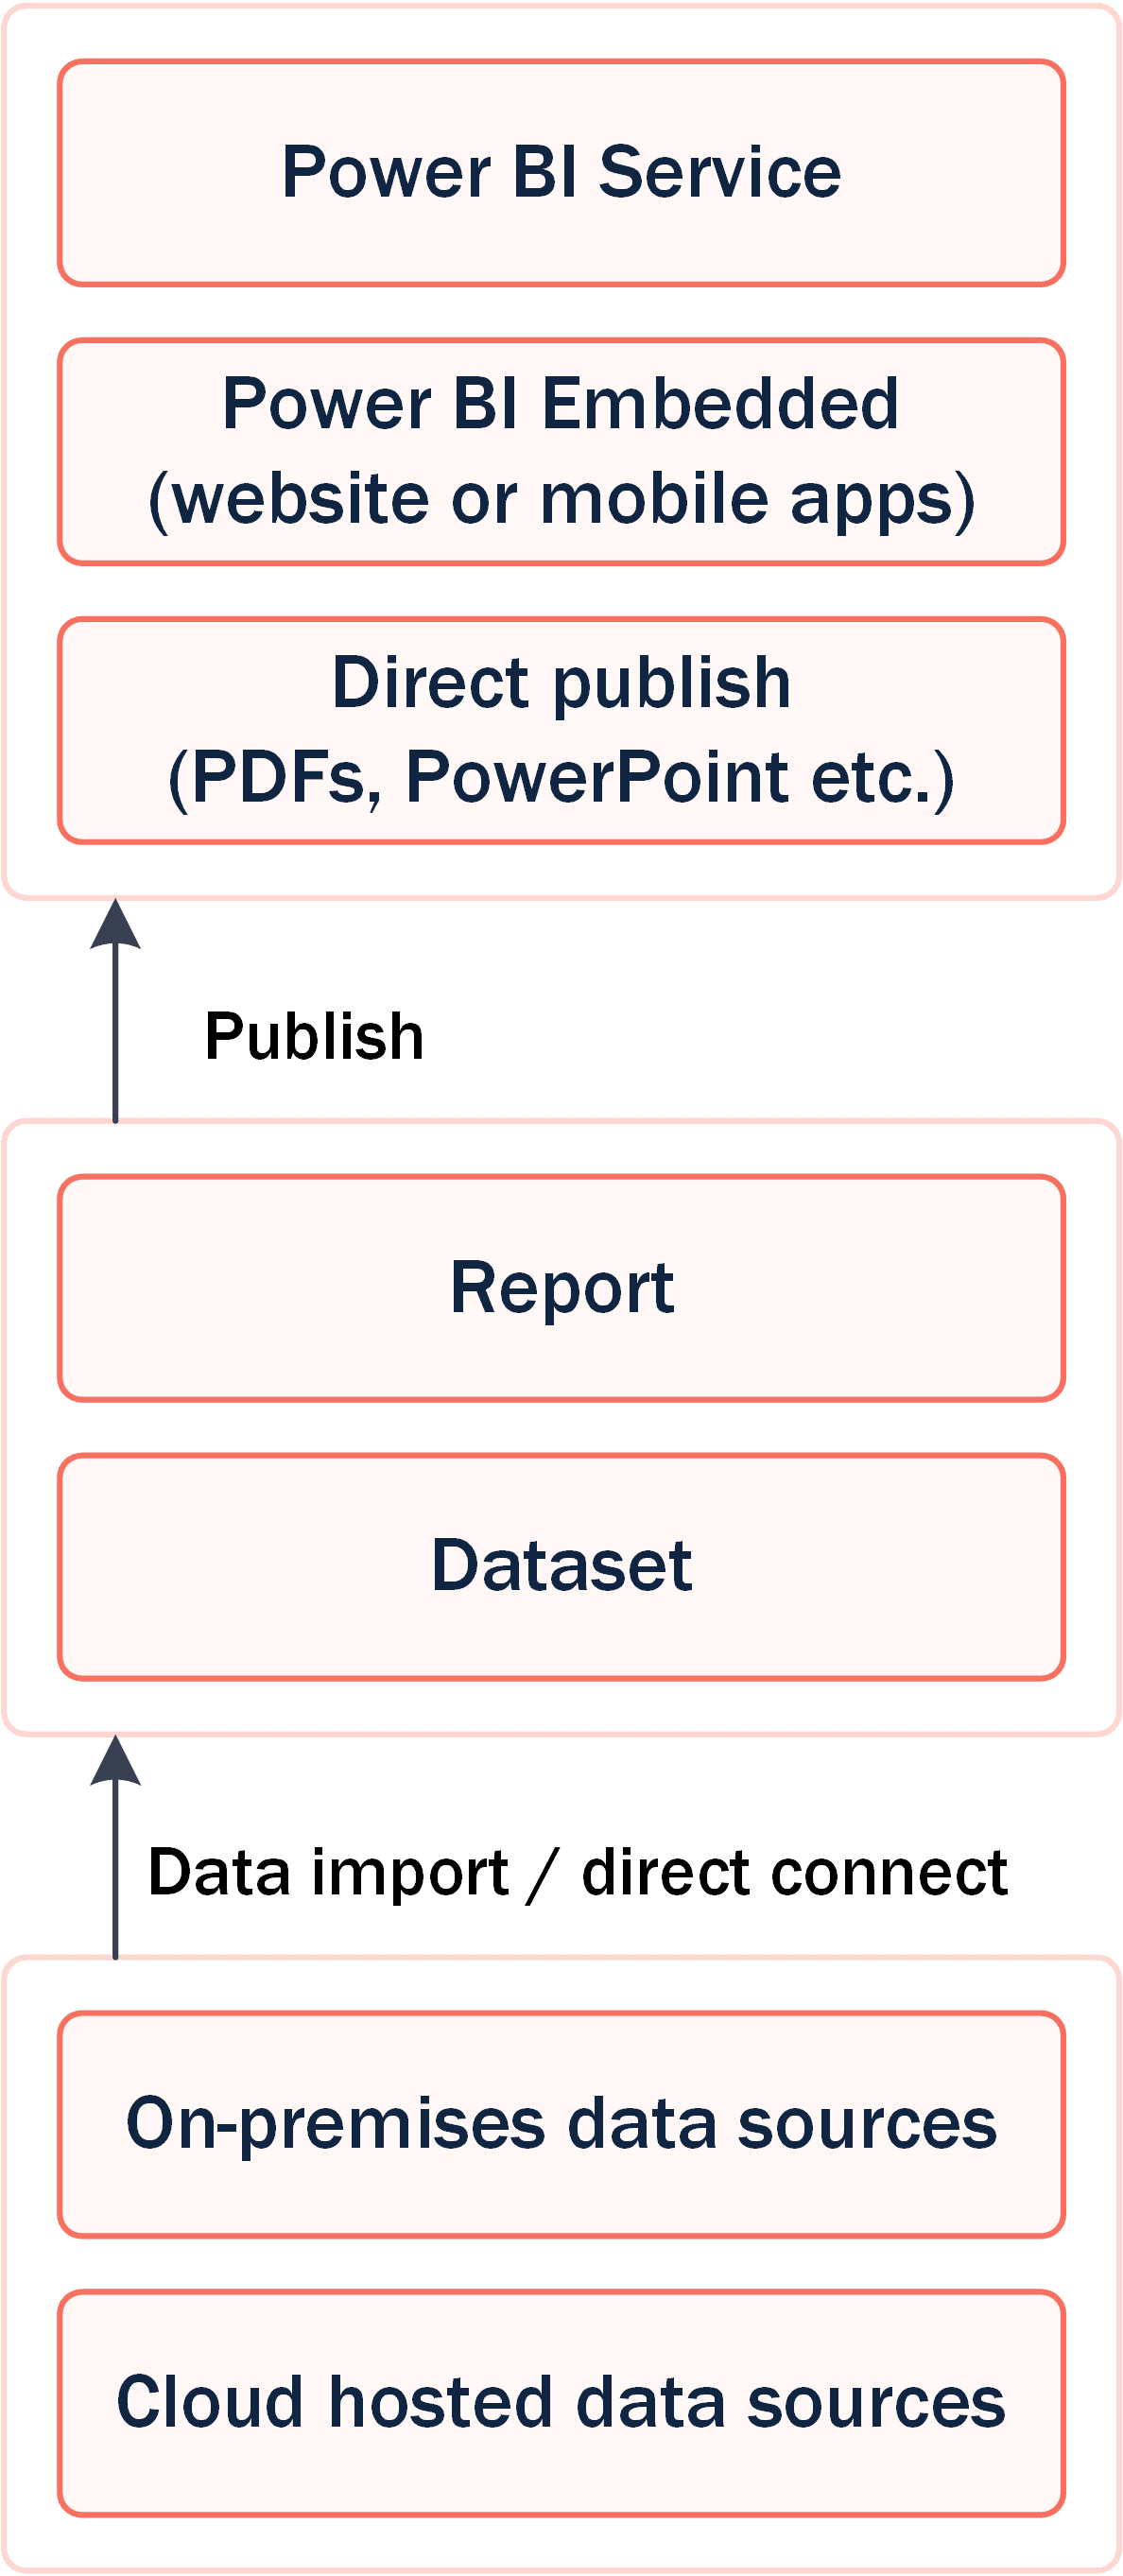
Power BI brings capabilities to organisations that would previously have been out of reach. It benefits from integration with the Azure platform and connects to both on-premises and cloud-hosted data sources.
We love helping organisations of all sizes understand the potential and deliver powerful business intelligence solutions.
How we help teams deliver Power BI solutions
Power BI report design and development
Data analysis and visualisations to create custom reports and dashboards.
Data engineering
Analysis and engineering services to make your data available for reporting.
Report automation
Automated solutions to keep your data refreshed automatically and up to date.
Custom website integration
Application development services to publish your reports to public and private websites.
The benefits of Power BI
- Business users have access to powerful tools for creating data-driven reports.
- Create interactive reports and charts.
- Combine multiple data sources for more in-depth analysis.
- The information can be automatically updated, including in real time.
- Support for a wide range of data sources, including SQL Server, Oracle, Salesforce and content in Azure Blob storage.
- Easy and secure to share reports and their underlying datasets for collaboration with team members are the wider business.
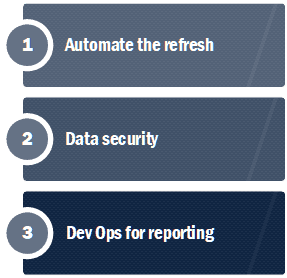
Secrets to success with Power BI
Power BI makes it very easy to get started with data analysis. Creating an effective ongoing reporting solution requires additional steps to keep reports up-to-date and secure. Also, it's essential that reports are easy to produce and don't become a burden.
-
Automate the data refresh
Power BI has a concept of separating the reports from the underlying data. The simplest way to get started is to import data directly into the Power BI Desktop application. The report administrator can refresh the data when it changes and republish the report.
An alternative approach is to make a direct connection to the source data. While this makes refreshing automatic, it can have some security and performance issues. (You might not want your reports to have a live connection to the source data system.)
Publishing the reports (and datasets) to the Power BI Service is often a usual approach the ensuring the data is up to date without a manual refresh. Scheduled updates to a report's dataset can be created, allowing the reports to update automatically. The connection to the source databases can be authenticated securely, for example, with a service principal and secret. This approach resolves the problem of an end user's credentials stored in a report (which would cause the report to fail if their password changes or multi-factor authentication is required).
-
Data security
Securing Power BI is a crucial but complex, multi-layered approach.
Reports must authenticate to their data sources. Embedded reports must ensure access is granted only to authorised people and just to their own data if multi-tenanted. Row level security can restrict the data shown in a report according to the user's permissions. Filters restrict the data on a row-by-row basis.
The Power BI Service (and Power BI Embedded) is a cloud-based platform. Secure access to on-premises data sources is possible with the data gateway. An on-premises server hosts the Data Gateway software; the Power BI Service connects to the Data Gateway via Azure Relay. Power BI and Azure handle much of this complexity. Data is sent securely (encrypted with TLS) and routed to avoid the public internet once it has reached the Azure Relay.
Azure data centres store the imported data. In general, the location of the data (i.e. the Azure region) is determined by the user's home tenant when creating the Power BI Service. Power BI Premium supports a more flexible data residency configuration that is most useful for multinational enterprises.
-
Dev Ops for reporting (housekeeping and admin)
Datasets and reports can quickly become complex, slow and hard to maintain. Careful planning is often essential.
It is often possible to improve the performance of reports and charts. Early data filtering can make reports faster and give the cache a better chance of success. Limiting the number of visuals on a report (or separating a large report into separate chunks) can reduce the time to display. Diagnostics and monitoring tools are available to investigate poor-performing reports.
Separating report creation from test and production environments is often helpful. GDPR will often influence the separation of data environments. Deployment Pipelines are very useful for managing the development lifecycle of datasets and reports. Deployment Pipelines bring a dev-ops approach to analytics. They help improve governance, version control, reusability, separation of concerns, simplify deployment and allow for rollback.
Creating effective Power BI reports
We love helping teams create reports and dashboards that communicate complex data to their decision-makers. Some of our tips and suggestions are listed below.
Change the defaults
Reports can be much more compelling with a little customisation effort. Themes allow visualisations to be styled consistently with organisation branding. JSON is used to define themes, but web-based theme generators are available.
When choosing colours, consider the contrast levels to keep your reports accessible. Also, consider adding differentiators other than colour (such as shape).
Choose the most suitable data visualisation
Simple chart types are often the most effective. Pie charts can be more difficult to compare values than simple bar charts. 3D charts are often much harder to read.
Take time to remove everything you can whilst keeping the charts easy to understand. Removing unnecessary levels of precision or repetitive labels will usually make charts more accessible.
Consider the message you need to communicate when selecting the right visual. For example, consider line or area charts if you are showing changes over time. Consider bar charts if you have values in separate groups that you want to compare.
Make your reports interactive
One of the most powerful features of Power BI is adding interactivity. Interactivity gives end users of your reports the ability to access information most important to them and helps them to understand the message.
Power BI allows the report designer to control the behaviour when a user interacts with your charts. Charts can filter other visualisations in the Power BI report when selecting data points.
Charts can also be "drilled-down" (or drillthrough) to let your end-users explore the background of the data. The drilling behaviour is extremely flexible and even supports drilling to a separate report.
Publishing your Power BI reports
We help teams publish their reports and dashboards in various ways.
Exporting your reports to PDF and PowerPoint
Reports can be exported directly as PDFs from Power BI desktop. The Power BI service also supports exporting to PDF and allows the export of reports as PowerPoint slide decks.
These exports are static, so the visualisations lose their interactive behaviours but are easy to distribute to a wide range of users.
Publishing to shared Power BI workspaces
Workspaces are one of the most powerful features of Power BI for collaboration. Teams can work together on reports and datasets published in a shared workspace.
Datasets and reports can be published to a personal or shared workspace once ready for distribution. Users will need a Power BI Pro license, or the workspace will need a Premium capacity assigned to it.
Reports can be shared with users inside and outside your organisation once published in a workspace.
Add your reports to websites using Power BI Embedded
Embedding allows publishing reports to public websites and private web-based applications where user authentication is required.
Some reports require more in-depth security. For example, some application users will have permission to access certain sections of data relevant to their role. For multi-tenant web applications, reports must show different data according to the user's tenant. Multi-tenant security usually requires the API to exchange the web application's security token for a Power BI embed token. The embed token then grants the report access to the appropriate content.
To find out more, please contact us...
Services
Our skills
Viewpoint BI is powered by HR-Fundamentals ltd. © HR-Fundamentals ltd.
Registered in England and Wales, number 0461 5583.
20 Market Place, Kingston upon Thames KT1 1JP